


- Robotics - Automation - Industrial IT
- Industrial Software
- Data collection software
- BANALYTICS sp. z o.o.
Monitoring software Banalytics AI Data Collection Platformautomationdata acquisition and analysisdata collection

Add to favorites
Compare this product
Characteristics
- Function
- image acquisition, monitoring, reporting, synchronization, for remote access, automation, notification, data acquisition and analysis, data acquisition and historization system, dashboard, data archiving, data transfer, for anomaly detection, data collection, data logger, event recorder, data export, labeling, remote condition monitoring
- Applications
- laboratory, industrial, R&D, machine vision, for sensors, for IIoT applications, for testing machine, edge computing, for robotics, for robotic applications, for AGV
- Type
- real-time, automated, web-based, open platform, MQTT
- Operating system
- Windows, Linux, web browser
- Deployment mode
- cloud-enabled, on site
Description
Product overview
Banalytics gives AI/ML data teams a single edge layer for collecting reliable training data. It connects to cameras, sensors, and robotics hardware, applies event-driven capture logic instead of blind recording, and tags every sample with synchronized timestamps and context. Worth knowing upfront: what you're looking at is actually one product, presented two ways depending on which part of it matters most to your team day-to-day:
Problem this solves
How it works
Architecture example
AI data collection monitoring
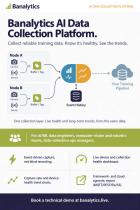
Node A (Warehouse robot test): 3 ONVIF cameras + IMU sensor · MQTT · local capture
Node B (Outdoor test track): 2 cameras + GPS module · USB/serial
Node C (Lab bench): 1 high-speed camera + hardware trigger · USB
All nodes → Banalytics Dashboard · capture-rate & storage monitoring · export via MQTT/S3
AI data collection analysis
Node A → Event History logs captures + tags → dashboard shows capture-rate trend
Node B → Event History logs captures + tags → dashboard shows device-health trend
All nodes → Banalytics Dashboard · trend charts · export to your own analysis/training pipeline
Who this is for
Key features
Technical specifications
Way of work
Phase 0: Technical demo (free). The full collection-and-export flow shown live using representative or mock devices.
Phase 1: PoC / Collection design (always free). Device inventory, trigger conditions, and export interface agreed against mock or pre-recorded inputs.
Phase 2: Funded Pilot. Real devices, real site, validated trigger, capture, export, and collection-health reporting on live data. Commercial only once real hardware is connected, a scoped rollout-assistance engagement is purchased, or a custom device/3rd-party software integration is required.
Phase 3: Production. Multi-node, multi-site continuous collection with reporting at scale; ongoing use, paid only for the activated modules and engineering support if requested.
Banalytics gives AI/ML data teams a single edge layer for collecting reliable training data. It connects to cameras, sensors, and robotics hardware, applies event-driven capture logic instead of blind recording, and tags every sample with synchronized timestamps and context. Worth knowing upfront: what you're looking at is actually one product, presented two ways depending on which part of it matters most to your team day-to-day:
- AI data collection monitoring: device and collection health across every node, capture rate, event counts, and storage, from one dashboard.
- AI data collection analysis: the trend and reporting layer on the same collection data, capture-rate history, device-health trends, and structured exports, without Banalytics ever running your actual model or analysis.
Problem this solves
- AI data collection monitoring. Manual field collection and one-off scripts don't scale across devices and sites; teams typically discover collection failures only after checking the export, hours or days too late.
- AI data collection analysis. Understanding collection quality and trends over time, whether capture rate is dropping, which nodes are underperforming, how much usable data was collected this week, normally means building a separate custom dashboard or script on top of raw collection logs.
How it works
- AI data collection monitoring. Devices stream into Banalytics → event-driven capture windows apply triggers and synchronized multimodal tagging → device and collection health (capture rate, event counts, storage) is visible from one dashboard → structured samples export via MQTT, REST, file, or S3 to your training pipeline.
- AI data collection analysis. The same Event History log that powers monitoring is queried for trends → capture rate and device health history render as charts over time → structured, tagged exports remain available for your own analysis or labelling pipeline.
Architecture example
AI data collection monitoring
Node A (Warehouse robot test): 3 ONVIF cameras + IMU sensor · MQTT · local capture
Node B (Outdoor test track): 2 cameras + GPS module · USB/serial
Node C (Lab bench): 1 high-speed camera + hardware trigger · USB
All nodes → Banalytics Dashboard · capture-rate & storage monitoring · export via MQTT/S3
AI data collection analysis
Node A → Event History logs captures + tags → dashboard shows capture-rate trend
Node B → Event History logs captures + tags → dashboard shows device-health trend
All nodes → Banalytics Dashboard · trend charts · export to your own analysis/training pipeline
Who this is for
- Robotics & autonomous systems teams: capture synchronized multimodal training data (camera, sensor, telemetry) from test rigs and field deployments.
- Computer-vision teams: collect and tag real-world footage across multiple devices and sites without manually reviewing every clip.
- AI/ML data engineering teams: monitor and export collection health across a growing fleet of edge devices, feeding any training pipeline.
- Data-collection operations managers: track capture rate, device health, and storage across every node from one dashboard, without visiting sites.
Key features
- Event-driven capture: triggers a capture window instead of recording blindly.
- Pre-trigger buffering: captures the moments just before a trigger fires, not only after.
- Synchronized multimodal tagging: every sample carries a timestamp, trigger source, health state, and labels.
- Live dashboards for capture rate, event counts, device health, and storage across every node.
- Capture-rate and device-health trend charts, built on the same Event History log.
- Local archive as source of truth: collection continues and is preserved regardless of network status.
- Framework- and cloud-agnostic export: MQTT, REST, file handoff, or S3-compatible push.
- No custom acquisition code required per device brand.
Technical specifications
- Supported protocols: ONVIF, RTSP, MQTT, USB/serial, Modbus.
- Deployment: works with existing camera, sensor, and robotics hardware; no mandatory cloud migration; local archive remains authoritative regardless of connectivity.
- Tagging: every sample includes timestamp, trigger source, health state, and user labels.
- Export: MQTT, REST, file handoff, or S3-compatible push; framework- and cloud-agnostic, with no assumption about your training stack.
- Reporting: trend charts and Event History queries for capture rate, device health, and storage over time.
- Scalability: supports multi-node, multi-site continuous collection.
Way of work
Phase 0: Technical demo (free). The full collection-and-export flow shown live using representative or mock devices.
Phase 1: PoC / Collection design (always free). Device inventory, trigger conditions, and export interface agreed against mock or pre-recorded inputs.
Phase 2: Funded Pilot. Real devices, real site, validated trigger, capture, export, and collection-health reporting on live data. Commercial only once real hardware is connected, a scoped rollout-assistance engagement is purchased, or a custom device/3rd-party software integration is required.
Phase 3: Production. Multi-node, multi-site continuous collection with reporting at scale; ongoing use, paid only for the activated modules and engineering support if requested.
Catalogs
Other BANALYTICS sp. z o.o. products
Solutions


Related Searches
- Management software solution
- Automation software solution
- Analysis software solution
- Real-time software solution
- Windows software solution
- Online software
- Control software solution
- Monitoring software solution
- Industrial software solution
- Measurement software
- Visualization software solution
- Automated software
- Reporting software solution
- EDM software
- Machine software
- Data acquisition software
- Centralized software solution
- Product lifecycle management software
- Calibration software
- HMI terminal programming software
*Prices are pre-tax. They exclude delivery charges and customs duties and do not include additional charges for installation or activation options. Prices are indicative only and may vary by country, with changes to the cost of raw materials and exchange rates.