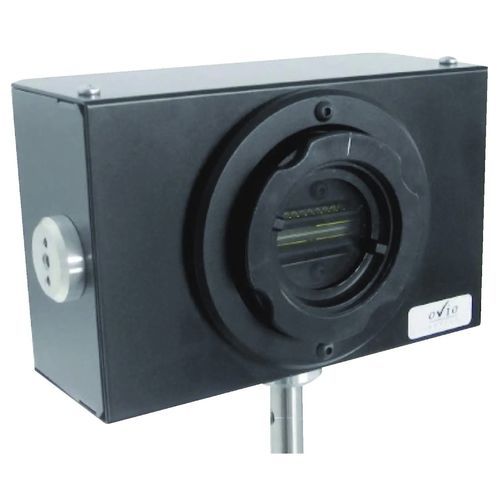
• Summary: 3648-pixel bar, 16 bits of vertical resolution
• Easy to use: complete embedded educational software
• Ready to use: software, filters, and connectivity provided
This device allows the study of the light intensity received by the CCD sensor as a function of position (in pixels or mm) or over time.
Immediate results:
- Plug in your device and get your figure right away.
- Easy to use and practical:
. Built-in assistants during the execution of the manipulations
. Accessible and powerful functions
. Ability to save your data in internal memory
. Instant setup of filters with the Clix system
High-quality results:
. A 16-bit dynamic range providing 65536 levels of precision
. High signal stability
. Accuracy of your measurements: 1 pixel every 0.8 µm
Direct comparison to theory:
. Graphical and numerical modeling
. Predefined models: cardinal sine, Young's slits
Built to last:
. Extremely robust metal structure
. 5-year warranty!
The high resolution of the sensor limits saturation and noise phenomena. For diffraction and interference labs, it is thus possible to visualize the secondary lobes without saturating the main lobe.
The embedded software simplifies the use of the equipment to focus on experiments.
It automatically deploys on your computer upon connection of the sensor.
Acquisition is guided according to 2 modes:
- Intensity as a function of position, for diffraction and interference labs, for example
- Intensity as a function of time for a specific portion of the sensor
Many tools are then available to process the obtained curves: pointer, modeling, spreadsheet, report ...

