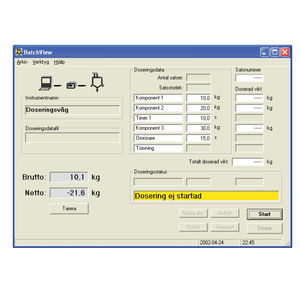
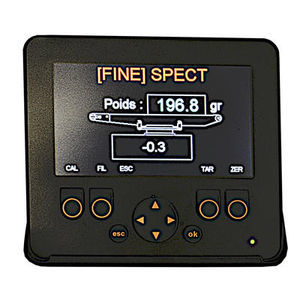
... BatchView is a PC software for remote monitoring and control of the batching functions in BLH Nobel’s weight indicator TAD 3 with batching option. It runs under Windows 95/98/NT4/Me/2000/XP/Windows 7/ Windows 8/Windows 10. Functionally, ...

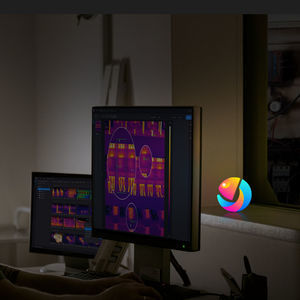
... Professional inspection software with database function. Includes reference image and problem solution database. Inspect - Categorize - Analyze - Document Live and still image windows for documentation and control "Snapshot" function ...
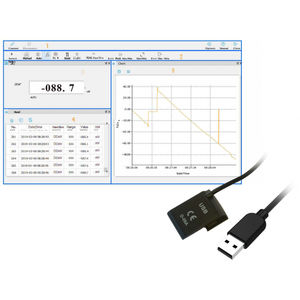
... HIKMICRO Analyzer is a professional and free software that allow users to view, edit, analyze images Flexible File Manager HIKMICRO Analyzer supports materials filing system. You can import materials to the set where further scan, ...
... health of the network and the elements needed for decision making. Main Features • - Device discovery, listing and visualization • - Device grouping • - Access credential maintenance • - Network parameter configuration, and mass-configuration • ...
... It is a software developed by ICP DAS for WISE/PMC/PMD controllers for use in a variety of Industrial IoT applications. IoTstar can be installed on a general PC platform and works as a Private IoT Cloud system, or on the VM (Virtual Machine) ...
... Product description
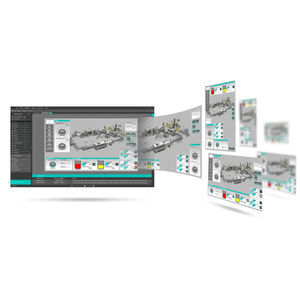
KREO HMI is a web-native HMI platform for creating supervision and distributed automation applications based on HTML5 and JavaScript. Native HTML5 video pages are generated at compilation, enabling deployment to multiple ...
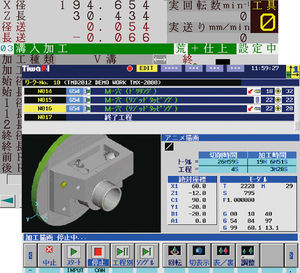
... Dialogue
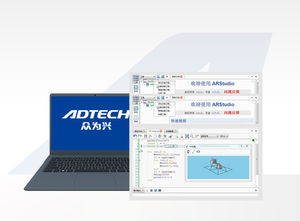
software provides interactive support for CNC program creation, simulation and automatic operation to reduce operator labor and speed up program verification.
Overview
- Interactive dialog-based software
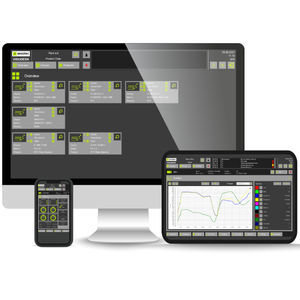
... increase process efficiency and minimise production line downtime. Performance features VISUDESK, the new visualisation software for sorting machines, makes your sorting processes transparent and enables direct control for higher ...
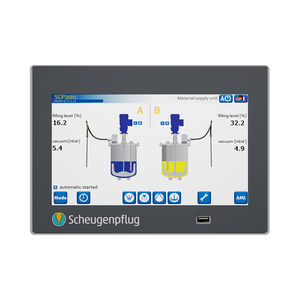
... and feeding systems as well as manual work stations are equipped with the specially designed SCP210 micro-controller and visualization unit. The SCP210 is an advanced version of the proven operating unit SCP200. It monitors and controls ...

... Innovative visualization of eddy current signals for component testing In combination with a STATOGRAPH module, the STATOVISION software enables the visualization of eddy current signals in a clearly ...
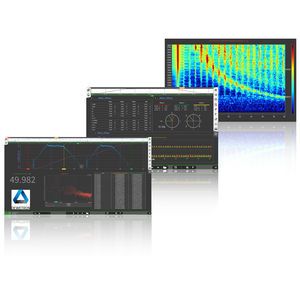
... measurement software is available. This includes extensions for Statistics like new calculations, overlapping options as well as overall statistics, CAN extentions, new export formats, and a lot more. Details see below. The OXYGEN ...
... One tool for everything The AIPEX engineering tool is a one-for-all solution. It enables the user to configure, parameterise, programme and diagnose applications and also debug CODESYS user programmes. AIPEX makes work easier and faster – AMKmotion modules ...

... machine downtime, reduce maintenance costs and improve machine reliability and production. Easy Connectivity & Data Visualization Improve Machine Reliability and Production ADLINK Edge™ MCM delivers uninterrupted 24-hour monitoring ...
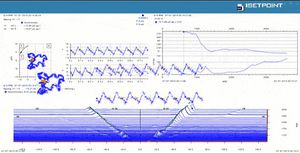
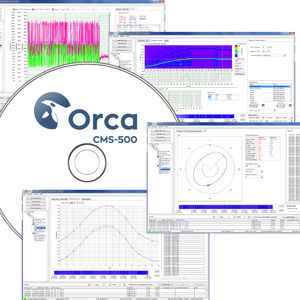
... online condition monitoring software solution for critical machinery, SETPOINT® CMS is designed for use in the hydrocarbon processing, petrochemical, power generation, and other industries. It provides powerful visualization ...
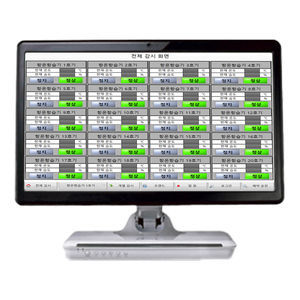
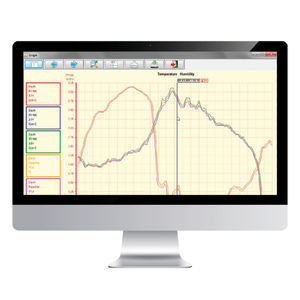
... history management for rapid response. - Real-Time Trend Monitoring Enables continuous system monitoring with live data visualization. - Customizable Reports & Data Management Supports editable report formats, allowing users to store, ...
Seungil Electronics
... weather measurement networks. The Lambrecht MeteoWare CS3 app provides support for the acquisition, provision, analysis, visualization and archiving of large data volumes. MeteoWare CS3 is a modular, scalable program package for ...
... : data visualization and configuration Server: data streaming and recording into SQL database PMS-300 Rhino and PMM-300 full integration Wide range of graphical data visualization Real-time and historical raw data ...
... Qlever is a software solution for the acquisition, analysis and visualization of data measured by TMI-Orion data loggers. With Qlever, you can : • define the conditions of use of TMI-Orion and customer equipment, • ...
... when configuring the Web Visualization / WebFront. The exact details and differences can be found in the following product matrix . Demo version Simply download and install the latest software. This way you can try out ...
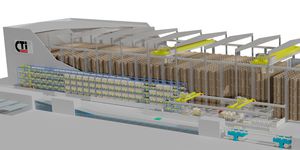
... output. The digital twin is also a virtual replica of a complete installation. This replica can be used to test and approve software adaptations before systems go live, which, again, minimises downtime. ...
... The eCal™ software application has been specially developed by SPEKTRA for calibration laboratories. eCalTM is simultaneously a universal calibration protocol viewer and a data transformation tool. The application can transfer calibration ...
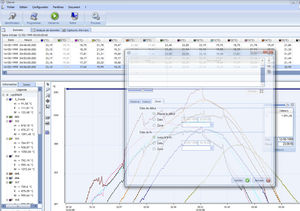
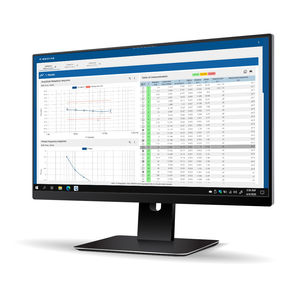
... formats, mathematical functions and visualisations • Optimized for durability testing and research Software for data analysis and visualization, optimized for the analysis of durability tests. Starter, Professional ...
Kistler
the best suppliers