
{{product.productLabel}} {{product.model}}
{{#if product.featureValues}}{{product.productPrice.formattedPrice}} {{#if product.productPrice.priceType === "PRICE_RANGE" }} - {{product.productPrice.formattedPriceMax}} {{/if}}
{{#each product.specData:i}}
{{name}}: {{value}}
{{#i!=(product.specData.length-1)}}
{{/end}}
{{/each}}
{{{product.idpText}}}
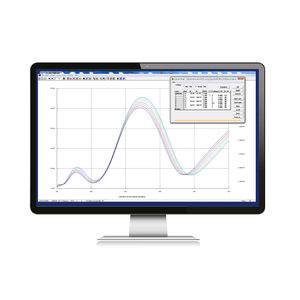
... Easily perform regular quality checks, and statistical reports which help reduce coating processes installation time, maintain machines in top conditions and assure highest coating quality. Easy-to-use software to ...

... efficient and easier than ever before, with improved Thermo Scientific Phenom FiberMetric Software. In combination with the Phenom Desktop SEM, the FiberMetric Software allows you to produce accurate size information ...

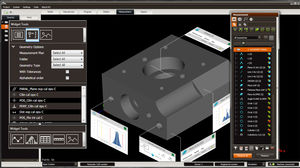
... mathematical functions. The software package adapts to your application and its programming needs. An icon-based UI makes this QUINDOS easy to use for both new and experienced users. Direct statistical analysis ...
... The Q-DAS statistical software is considered the standard for quality assurance in industrial production. Users worldwide trust the software and the associated training and consulting services to successfully ...
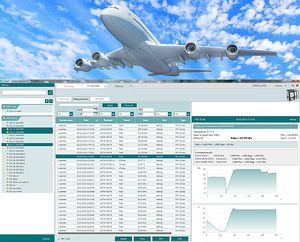
... FEATURES – DATA ACQUISITION AND HANDLING SOFTWARE - Emission data processing system compliant with current standards - User-friendly software interface with various modules for data management and analysis - ...
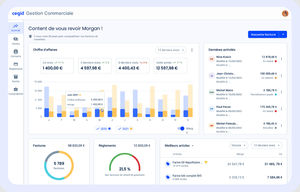
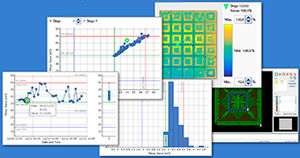
... business, too. The proprietary system provides statistical data that can help you uncover trends and identify areas of strength, areas where improvement is needed, and everything in between. Built-in statistical reports ...
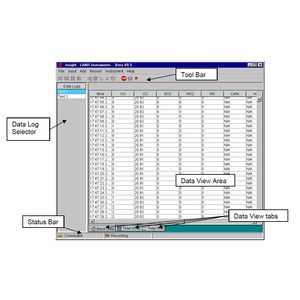
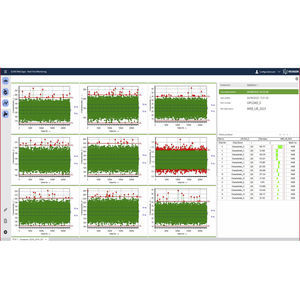
... provides the statistical and graphical tools for the viewing, in-depth analysis and presentation of collected data. Connected to the analyzer via RS232 cable Insight collects data in real time - permitting immediate ...
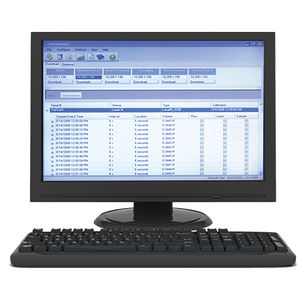
... Counter Software by Particle Measuring Systems PMS helps you understand the data coming from your particle monitor for an easy and low-cost way to effectively manage data, including maintaining electronic records. DataAnalyst Particle ...
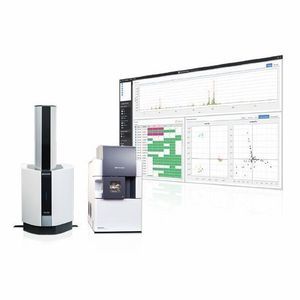
... features
- Statistical Analysis Mode: Univariate and multivariate analysis tools to differentiate samples and identify marker peaks.
- Discriminant Analysis
... formats for easy analysis and split files based on size or duration for optimal management. Control and Extend Execution The full-featured version of FlexLogger includes access to triggers, events, advanced filtering, statistical ...

... XFlow CFD is a high-fidelity computational fluid dynamics software that uses a mesh-free, Lattice Boltzmann approach to simulate complex fluid dynamics and interactions for a wide range of applications across multiple industries. XFlow ...
SIMULIA
... Increase operational efficiency and simplify your meter reading and billing processes with our AutoRead® software package. This program gives you the flexibility to manage all of our encoder-based Automatic Meter Reading (AMR) systems ...

... Based on rigorous modeling technology designed for process engineers to perform statistical data reconciliation of meters in processing units. What to Expect with Material Balance Module? Daily consistent and accurate mass and ...
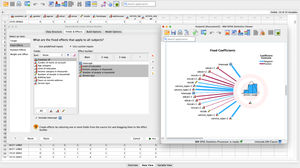
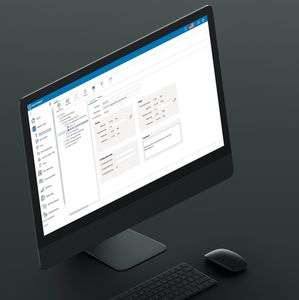
... IBM® SPSS® Statistics software provides advanced statistical analysis for users of all experience levels. Offering a comprehensive suite of capabilities, it delivers flexibility and usability beyond traditional ...
IBM

... cell, custom cell and memory characterization time and resources, while delivering production-accurate Liberty models and statistical data. Solido Characterization Suite The Solido Characterization suite works with any existing ...
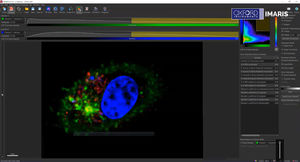
... easy to use software for making stunning Snapshots and Animations, generating quantitative information from their microscopy data, object to object distance and overlap measurements, co-localization studies, plotting and statistical ...
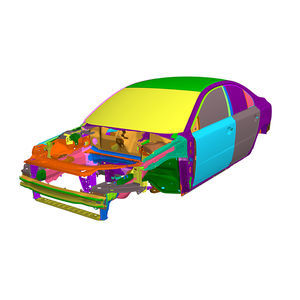
... Statistical Energy Analysis approach offers an efficient solution to study noise and vibration propagation inside large systems at mid- and high-frequencies. The global system is reduced to a set of coupled subsystems ...
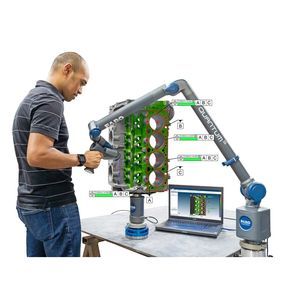
... trend and statistical process control (SPC) analysis. CAM2 Software is designed for use with any FARO coordinate measuring machine (CMM), enabling operators to capture accurate measurements. It’s the ...
... COCKPIT™ Software for Vision analyzers offers the utmost in flexibility. Lab managers use the PC software for Vision analyzers to consolidate measurement results and statistics from multiple locations in one central lab. ...
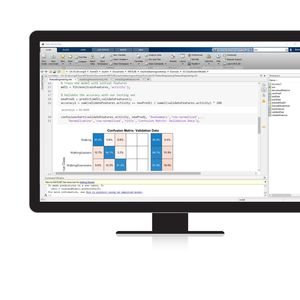
... Regression Learner apps, or programmatically, using AutoML. For multidimensional data analysis and feature extraction, the toolbox provides principal component analysis (PCA), regularization, dimensionality reduction, ...
The MathWorks
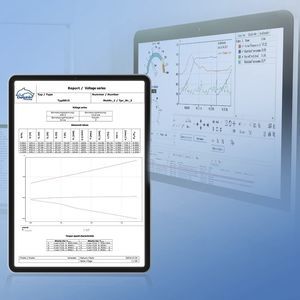
... Statistical analysis of metrological information and process data presented in personalized reports for full and real-time production traceability •Organise the information based on the parameters that interest you •Analyse the production ...
QS-Torque reliably checks fastening processes and tools in your production. In addition it is also able to handle process tests and test data. Thanks to this outstanding quality assurance, only first-class products leave your company. Individually definable ...
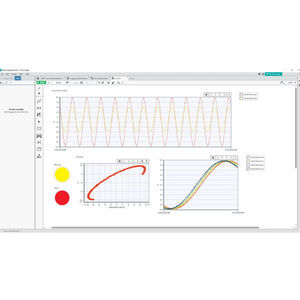
... suitable for users who want to evaluate measurement data acquired with the ProfiSignal software. They only need the Viewer programme on their PC. The ProfiSignal software is required to record measurement data. Another ...
... DATA ANALYSIS SOFTWARE UA1801 Data Analysis Software for Detecting Latent Defects on PASS Boards Overview Hioki PCB and substrate inspection equipment leverages our core competency ...
... Display of regulatory templates CALCULATION OF MEAN INDICATORS: Leq over period, Lden STATISTICAL CALCULATION: Per source, per period, etc. ANALYSIS OF METROLOGICAL SIGNALS: Replay, 1/N octave, FFT, short ...
the best suppliers